Week 8 2025 · October 18, 2025
Texas at Kentucky, Week 8 2025: who deserved to win?
Texas beat Kentucky 16–13, a result the replays rarely give: with the way both teams actually played, Kentucky wins 9 of 10. Luck ran its way: kicks alone were worth 22 points of win probability to Texas.
Texas won on an off day: its offense played far below its usual level. In a fresh game against Kentucky it would win 69% of the time; with this day’s form, 7%. The numbers
Before kickoff Texas was a 79% favorite. The biggest swing (OT): M. Shipley made a 45-yard field goal, worth 13 points of win probability to Texas.
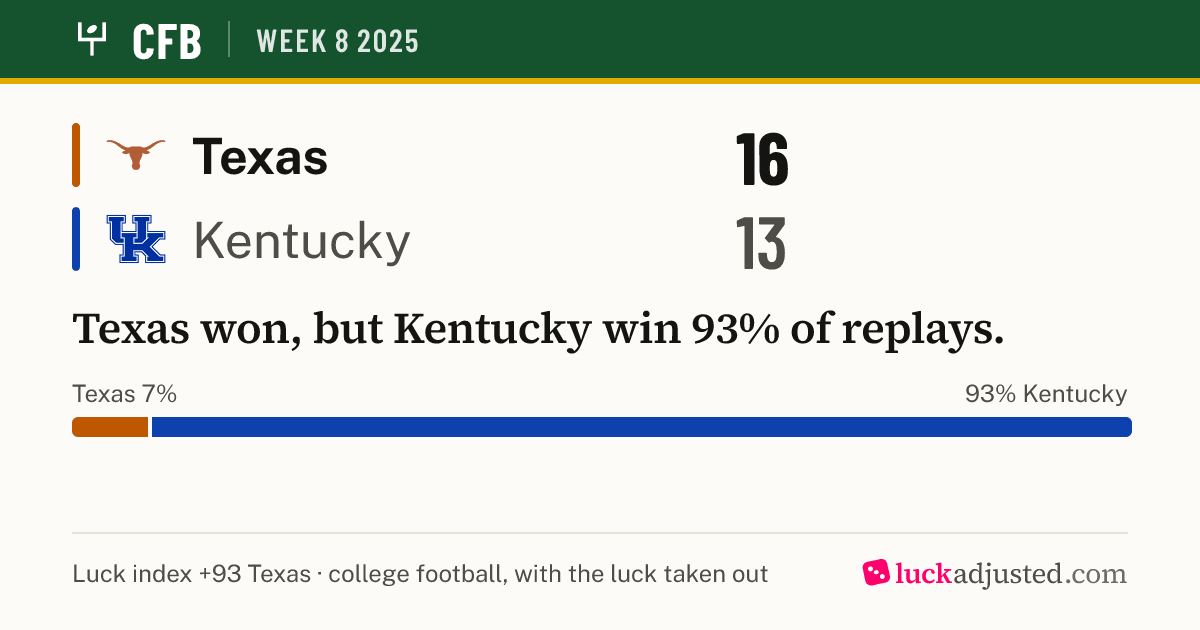
Final (OT)
 Texas Longhorns Texas Longhorns | 16 |
|---|---|
 Kentucky Wildcats Kentucky Wildcats | 13 |
Replay with same day's form
Luck index +93 Texas very lucky · −93 Kentucky
Each team’s own plays from this game, resampled into new drives 4,000 times: with the way both teams actually played, how often does this performance win? How the replay works
Ten replays. Texas wins 1, Kentucky wins 9.
- 1 TEX 20 UK 14
- 2 TEX 21 UK 24
- 3 TEX 3 UK 10
- 4 TEX 7 UK 17
- 5 TEX 13 UK 27
- 6 TEX 10 UK 27
- 7 TEX 3 UK 23
- 8 TEX 14 UK 38
- 9 TEX 3 UK 30
- 10 TEX 0 UK 35
Three other ways to ask
Each answers a different question, so none of them replaces the replay above.
Before kickoff
The closing betting line, turned into a probability. What everyone knew before the game.
Same teams, fresh game
The line plus what this game showed, weighted by how much one game can tell. It stays close to the line because one game says little.
Only coin-flips re-rolled
Every kick, fumble bounce, conversion and judgment call redrawn; everything else fixed. The narrowest view of luck.
Texas won on an off day
Its offense played far below its usual level. In a fresh game against Kentucky it would win 69% of the time; with this day’s form, 7%.
Same teams, fresh game
Replay with same day's form
62 points apart for Texas: the gap is how differently this game went from what the two teams usually are.
| Unit | This game | Usual level | Better or worse than usual |
|---|---|---|---|
| Texas offenseEPA per play gained | −0.28 | +0.07 | worse by 0.35 |
| Texas defenseEPA per play allowed | −0.03 | +0.01 | better by 0.04 |
| Kentucky offenseEPA per play gained | −0.03 | −0.02 | worse by 0.01 |
| Kentucky defenseEPA per play allowed | −0.28 | +0.10 | better by 0.37 |
EPA (expected points added) per play on competitive snaps, turnovers left out because they are valued as luck. Usual level: the team’s earlier games this season plus half of last season, pulled toward the league average. One team’s defense and the other team’s offense are the same snaps, so one game can’t fully say whose day it was; it shows how far this one was from both teams’ norms.
How 4,000 replays ended
Texas wins 7% of them, Kentucky 93%, counting the 1% still level after regulation as half each. The line is what actually happened: Texas by 3.
Show as a table
| Final margin in the replays | Share of replays |
|---|---|
| Texas by 17+ | 0.2% |
| Texas by 9–16 | 1.4% |
| Texas by 1–8 | 4.9% |
| Level after regulation | 1.0% |
| Kentucky by 1–8 | 12.0% |
| Kentucky by 9–16 | 20.1% |
| Kentucky by 17+ | 60.4% |
Where the luck was
What the luck was worth
Every lucky and unlucky play, weighted by the moment it happened: its swing in win probability, added up by kind. A missed kick in a decided game counts for nothing; the same kick at the end of a tie game can be most of a win.
The kicks
How likely each kicker was to make that kick (his own record, the distance), and what happened.
- J. Kauwe, 53 yds missed · 50% expected
- J. Kauwe, 46 yds made · 62% expected
- M. Shipley, 53 yds made · 49% expected
- M. Shipley, 39 yds made · 75% expected
- J. Kauwe, 45 yds made · 64% expected
- M. Shipley, 45 yds made · 64% expected
Penalties: Texas 7 for 40 yards, Kentucky 3 for 25 yards
Every accepted flag, in order, and what it did to the helped team’s chance of winning at that moment, including any play it wiped out (points on the scoreboard in grey). A flag in a decided game is worth nothing; one at the turn of a close game can be worth most of a win. Judgment calls count toward luck, pre-snap fouls mostly don’t. How calls are valued
| When | Flag | Win probability for |
|---|---|---|
| Q1 7:16 | False Start on Texas, 5 yards · pre-snap | +1% UK +0.9 pts |
| Q1 7:10 | Penalty on Texas, 0 yards | 0% UK 0.0 pts |
| Q1 7:10 | Penalty on Texas, 5 yards | +1% UK +0.3 pts |
| Q1 6:06 | Pass Interference on Kentucky, 15 yards | +2% TEX +1.4 pts |
| Q1 1:01 | Illegal Shift on Kentucky, 5 yards · pre-snap | +1% TEX +0.8 pts |
| Q4 15:00 | Illegal Snap on Texas, 5 yards · pre-snap | +1% UK +0.4 pts |
| Q4 12:45 | Pass Interference on Texas, 15 yards | +2% UK +0.6 pts |
| Q4 4:26 | False Start on Kentucky, 5 yards · pre-snap | +3% TEX +0.5 pts |
| Q4 2:00 | False Start on Texas, 5 yards · pre-snap | +4% UK +0.5 pts |
| Q4 0:20 | Offside on Texas, 5 yards · pre-snap | +1% UK +0.3 pts |
When it happened
Kentucky’s chance of winning
As low as 0% and as high as 54%. Numbers mark the biggest luck moments, listed below.
| # | When | What happened | Win probability for | Next drive |
|---|---|---|---|---|
| 1 | Q1 4:28 | Texas converted 3rd & 123rd & 4th downs · 22% expected | +5% TEX | TEX: Punt |
| 2 | Q2 14:47 | Kentucky converted 3rd & 63rd & 4th downs · 34% expected | +5% UK | UK: Punt |
| 3 | Q2 11:08 | Texas converted 3rd & 133rd & 4th downs · 21% expected | +5% TEX | TEX: Punt |
| 4 | Q3 6:38 | Kentucky converted 4th & 23rd & 4th downs · 59% expected | +5% UK | UK: Field goal |
| 5 | Q3 2:05 | M. Shipley made a 53-yard field goalKicks · 49% expected for him, 2 of 4 from 45+ before | +6% TEX | TEX: Punt |
| 6 | Q4 10:57 | Texas was stopped on 3rd & 53rd & 4th downs · 39% expected | +6% UK | TEX: Punt |
| 7 | Q4 1:39 | Texas converted 3rd & 73rd & 4th downs · 32% expected | +6% TEX | TEX: Field goal |
| 8 | OT | M. Shipley made a 45-yard field goalKicks · 64% expected for him, 3 of 5 from 45+ before | +13% TEX | – |
Adjust the assumptions
Disagree with how much of a fumble bounce or a pass interference call is luck? Change it and the coin-flip replay reruns in your browser.
Only coin-flips re-rolled
Texas 38% · Kentucky 62%
- Final margin
- Texas by 3
- Luck in points
- 5.2 for Texas
- Luck-adjusted margin
- Kentucky by 2.2
- Replay with same day's form
- Texas 7% · Kentucky 93% unchanged: why
About these numbers
Play-by-play and expected points from CollegeFootballData.com via cfbfastR; win probability from our own model of the score, the possession and the betting line; kicks valued against each kicker’s own record. College play-by-play has no charting of drops or interception-worthy throws and no injury reports, so those kinds of luck aren’t counted here.
Methodology and validation · All Week 8 2025 games ·  Texas ·
  Kentucky
More from Week 8 2025
- Missouri at Auburn MIZ 23–17 · replay 32% for the winner
- LSU at Vanderbilt VAN 31–24 · replay 75% for the winner
- Tennessee at Alabama ALA 37–20 · replay 75% for the winner
- Texas A&M at Arkansas TA&M 45–42 · replay 78% for the winner
- Oklahoma at South Carolina OU 26–7 · replay 83% for the winner
- Mississippi State at Florida FLA 23–21 · replay 85% for the winner
- Ole Miss at Georgia UGA 43–35 · replay 87% for the winner
- Wyoming at Air Force AF 24–21 · replay 13% for the winner
- Louisville at Miami LOU 24–21 · replay 24% for the winner
- Washington State at Virginia UVA 22–20 · replay 29% for the winner
- Florida International at Western Kentucky FIU 25–6 · replay 33% for the winner
- Southern Miss at Louisiana USM 22–10 · replay 34% for the winner